NBA

In Season · Tuesday, October 27, 2026

Last refresh Oct 27, 2026 at 11:48 PM ET

← All games
DET
DET @ NYK
8:00 PM ET · Madison Square Garden
Final: DET 97 - 111 NYK

NYK
▶ Watch Game Simulation
Team StatusDefense vs PositionProps to Watch⏰ Halftime CheckerProp Streaks
DET 62% / NYK 38%Edge: model 62% → DET favored
TEAMPer-game team stats, 2025-26 season.
DETDET60-22
OFFENSE
PTS#8
117.8
8th most
REB#7
45.6
7th most
AST#10
27.8
10th most
STL#1
10.4
1st most
3PM#29
11
2nd fewest
DEFENSE
PTS AGST#3
109.6
3rd fewest
REB AGST#3
40.5
3rd fewest
AST AGST#1
23.5
1st fewest
STL AGST#23
8.9
8th most
3PM AGST#9
12.7
9th fewest
NYKNYK53-29
OFFENSE
PTS#10
116.5
10th most
REB#8
45.6
8th most
AST#13
27.4
13th most
STL#19
8.1
12th fewest
3PM#11
14.2
11th most
DEFENSE
PTS AGST#5
110.1
5th fewest
REB AGST#4
40.5
4th fewest
AST AGST#5
25
5th fewest
STL AGST#2
7.3
2nd fewest
3PM AGST#21
13.9
10th most
• OFFENSE: #1 = most per game (green = top 10)
• DEFENSE: #1 = fewest allowed (toughest). Green = softest 10 (most allowed), red = toughest 10
• White = middle 10
GOLD= Top 10SILVER= 11-30# = NBA rankMIN minutes · USG usage · PTS/REB/AST per game · 3PM threes · STOCKS steals+blocks · 2025-26 avgs, 20+ GP
DVPFantasyPros full-season 2025-26.
DET

DET players

vs NYK defense NYK
DETPointsPTSReboundsREBAssistsAST3PT3PMStealsSTLPARPARPRPRPAPARARA
Cade CunninghamCadeCunninghamSILVER MIN #20SILVER USG #12PG
#3
3rd Least
23.4
#1
1st Least
4.9
#2
2nd Least
7.4
#13
Neutral
3.0
#6
6th Least
1.7
#1
1st Least
35.6
#1
1st Least
28.3
#3
3rd Least
30.8
#1
1st Least
12.3
Duncan RobinsonDuncanRobinsonSILVER 3PM #20SG
#10
10th Least
21.5
#18
Neutral
6.4
#20
11th Most
5.1
#21
10th Most
3.2
#3
3rd Least
1.5
#14
Neutral
33.1
#13
Neutral
27.9
#13
Neutral
26.6
#17
Neutral
11.6
Ausar ThompsonAusarThompsonGOLD STOCKS #3SF
#7
7th Least
21.9
#21
10th Most
8.2
#4
4th Least
3.9
#18
Neutral
2.8
#3
3rd Least
1.4
#7
7th Least
34.0
#7
7th Least
30.1
#6
6th Least
25.9
#12
Neutral
12.1
John CollinsJohnCollinsPF
#5
5th Least
21.0
#2
2nd Least
8.5
#9
9th Least
4.1
#20
11th Most
2.5
#2
2nd Least
1.4
#3
3rd Least
33.6
#3
3rd Least
29.5
#6
6th Least
25.1
#2
2nd Least
12.6
Paul ReedPaulReedC
#3
3rd Least
20.1
#3
3rd Least
12.9
#1
1st Least
3.4
#23
8th Most
1.5
#4
4th Least
1.2
#3
3rd Least
36.4
#3
3rd Least
33.0
#3
3rd Least
23.5
#2
2nd Least
16.3
NYK

NYK players

vs DET defense DET
NYKPointsPTSReboundsREBAssistsAST3PT3PMStealsSTLPARPARPRPRPAPARARA
Jalen BrunsonJalenBrunsonGOLD MIN #10SILVER USG #15PG
#2
2nd Least
22.8
#7
7th Least
5.8
#1
1st Least
7.3
#1
1st Least
2.7
#28
3rd Most
2.1
#2
2nd Least
35.9
#2
2nd Least
28.6
#2
2nd Least
30.1
#2
2nd Least
13.1
Mikal BridgesMikalBridgesSG (SF)
#17
Neutral
22.2
#1
1st Least
5.7
#1
1st Least
4.1
#7
7th Least
2.9
#16
Neutral
1.8
#5
5th Least
32.0
#11
Neutral
27.9
#7
7th Least
26.3
#1
1st Least
9.8
Josh HartJoshHartSF (SG)
#3
3rd Least
20.9
#5
5th Least
7.5
#2
2nd Least
3.4
#15
Neutral
2.7
#8
8th Least
1.5
#2
2nd Least
31.8
#2
2nd Least
28.4
#2
2nd Least
24.3
#1
1st Least
10.8
OG AnunobyOGAnunobySILVER STOCKS #18PF
#16
Neutral
22.0
#12
Neutral
9.6
#18
Neutral
4.4
#15
Neutral
2.5
#27
4th Most
1.7
#14
Neutral
36.1
#11
Neutral
31.6
#17
Neutral
26.4
#15
Neutral
14.0
Karl-Anthony TownsKarl-AnthonyTownsGOLD REB #2C
#2
2nd Least
19.6
#4
4th Least
13.0
#4
4th Least
3.6
#16
Neutral
1.4
#23
8th Most
1.6
#1
1st Least
36.1
#1
1st Least
32.5
#1
1st Least
23.2
#4
4th Least
16.6
Per-game change in games the starter missed in 2025-26 vs games he played (teammates with 5+ of those games). Directional, not a projection - the sims price the full ripple when a sit is confirmed.
Cade Cunningham
Cade CunninghamSILVER MIN #20SILVER USG #12SILVER PTS #21 · PG DET
USG 26.9% · 33.9 MPG
Role ▲ (+4.3 mins L5: 29.6 vs 25.4)
Game log — full table ▾

Jalen Duren
Jalen DurenGOLD REB #8 · C DET
USG 23.6% ▲ · 28.2 MPG
Role ▼ (-8.4 mins L5: 23.8 vs 32.2)
Game log — full table ▾

Duncan Robinson
Duncan RobinsonSILVER 3PM #20 · SG (SF) DET
USG 22.5% · 27.4 MPG
Role ▲ (+1.1 mins L5: 27.1 vs 25.9)
Game log — full table ▾

John Collins
John Collins · PF (C) DET
USG 17.1% ▼ · 27.1 MPG
Role ▼ (-2.6 mins L5: 24.4 vs 27.1)
Game log — full table ▾

Ausar Thompson
Ausar ThompsonGOLD STOCKS #3 · SF DET
USG 15.8% · 26.0 MPG
Role ▼ (-3.1 mins L5: 24.6 vs 27.8)
Game log — full table ▾

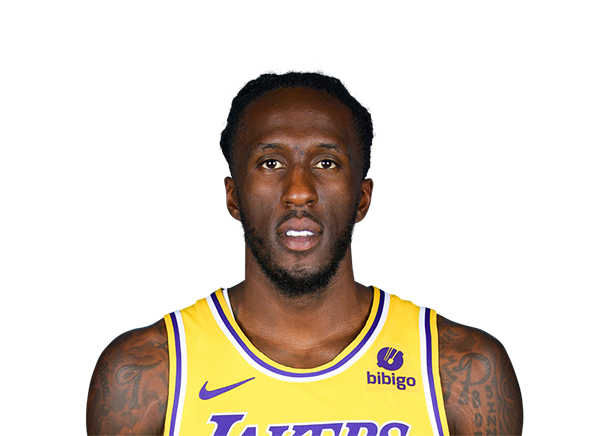
Taurean Prince
Taurean Prince · SF (PF) DET
USG 16.2% ▲ · 23.5 MPG
Role ▲ (+3.1 mins L5: 31.0 vs 27.9)
Game log — full table ▾

Kevin Huerter
Kevin Huerter · SG (SF) DET
USG 13.9% ▼ · 22.4 MPG
Role ▼ (-7.6 mins L5: 20.1 vs 27.7)
Game log — full table ▾

Isaiah Joe
Isaiah Joe · SF (SG) DET
USG 25.0% · 21.2 MPG
Role ▲ (+2.5 mins L5: 16.4 vs 14.0)
Game log — full table ▾

Elijah Harkless
Elijah Harkless · SG (PG) DET
USG 16.2% · 21.0 MPG
Role ▲ (+4.1 mins L5: 33.1 vs 28.9)
Game log — full table ▾

Daniss Jenkins
Daniss Jenkins · PG (SG) DET
USG 18.7% ▼ · 20.2 MPG
Role ▼ (-9.4 mins L5: 22.4 vs 31.8)
Game log — full table ▾

Paul Reed
Paul Reed · C DET
USG 16.5% ▲ · 13.9 MPG
Role ▲ (+4.4 mins L5: 19.5 vs 15.1)
Game log — full table ▾

Jalen Brunson
Jalen BrunsonGOLD MIN #10SILVER USG #15SILVER PTS #15 · PG NYK
USG 27.8% ▼ · 35.0 MPG
Role ▼ (-2.3 mins L5: 34.2 vs 36.5)
Game log — full table ▾

OG Anunoby
OG AnunobySILVER STOCKS #18 · PF NYK
USG 21.8% · 33.2 MPG
Role ▼ (-5.1 mins L5: 30.5 vs 35.6)
Game log — full table ▾

Mikal Bridges
Mikal Bridges · SG NYK
USG 13.0% ▼ · 32.8 MPG
Role ▼ (-6.3 mins L5: 24.7 vs 31.0)
Game log — full table ▾

Karl-Anthony Towns
Karl-Anthony TownsGOLD REB #2 · C (PF) NYK
USG 23.8% ▼ · 31.0 MPG
Game log — full table ▾

Josh Hart
Josh Hart · SF NYK
USG 16.1% ▲ · 30.2 MPG
Role ▲ (+3.9 mins L5: 33.1 vs 29.2)
Game log — full table ▾

Miles McBride
Miles McBrideSILVER 3PM #29 · PG (SG) NYK
USG 15.3% ▼ · 26.3 MPG
Role ▲ (+3.0 mins L5: 20.1 vs 17.1)
Game log — full table ▾

Landry Shamet
Landry Shamet · SG (SF) NYK
USG 16.5% · 23.0 MPG
Role ▲ (+2.7 mins L5: 23.1 vs 20.4)
Game log — full table ▾

1
OG Anunoby
OG Anunoby o1.5 STL
Soft vs PF all season (#27) + L7 (#24) · no potential data · hit 0 of 0
Minutes watch - soft matchup but not ranked:
⏳ Mohamed Diawara STL - bench role - minutes not bankable
Ranked: projected starters only · favorable vs position in both season and L7 · 🩹 players excluded until confirmed.
43ACTIVE STREAKS (4+)
4AT 10+ GAMES
29LONGEST
away game home game
Filters combine. Streaks use regular-season games vs current lines; combo lines are the sum of component lines.
Legend
🩹 Day-to-day / game-time decision / returning from injury
GOLD = Top 10 · SILVER = 11-30 · # = NBA rank · MIN minutes, USG usage, PTS/REB/AST per game, 3PM threes, STOCKS steals+blocks · 2025-26 avgs, 20+ GP
DvP rank: 1 = toughest defense vs that position, 30 = softest (higher # = softer)
Potential = FGA (pts) / potential assists / rebound chances / deflections · 2025-26 Hoops Junkie per-game (top-50 lists only)
Positions cross-checked: ESPN depth chart + RotoWire projected/confirmed · lineup checks run staggered through the day